
It can be hard to see the big picture view of the effectiveness of your videos when you have to look at individual video analytics. Luckily, if you are using Kaltura videos, you can see dashboards of all your user or course video analytics!
User analytics look at all user videos across your account: published in Mediaspace, shared via a link, embedded in courses.
Course analytics will look at all the videos in your course wherever they have been added: Media Gallery, course Content area, or embedded in announcements, etc. with the Insert Stuff tools.
User Analytics
This is an overall dashboard we’ve recently enabled and it is available from MediaSpace or Brightspace.
In MediaSpace you can find it the user account menu. In Brightspace it is a button in the My Media library.

Screenshot of My Analytics in the MediaSpace menu

Screenshot of My Analytics button in My Media on Brightspace
Individual Course Analytics
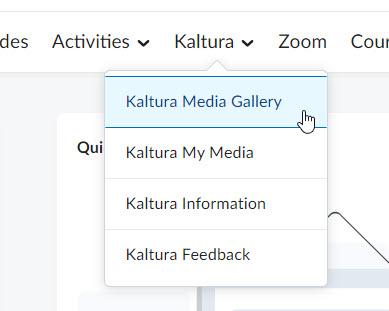
To find this analytics dashboard head over to your Brightspace course. From the Kaltura menu, choose Kaltura Media Gallery.
You may not being utilizing the Media Gallery for your course. That is fine. This is still where you will go to see the course video analytics.
From the Media Gallery, click the action menu in the upper right corner.
In the menu that appears, choose Analytics.

This first dashboard view includes
- videos that are embedded in the course
- analytics for those videos from anywhere they are embedded (including in other courses)
From here we will filter down our results a bit more to see only the analytics for video usage within this course.
There is a box on the right side of the dashboard titled Category Page Views. Click the Filter link in that box.

Now we see the filtered dashboard where we will find all our course video insights. Below is a full page screenshot of this dashboard.

Analytics Metrics
What metrics can we see on these dashboards?
Filter by Dates – default is 30 days but can change to show other time periods
Highlights – overview of player impressions, plays, minutes views
Top Videos, Top Viewers– a quick view of the top 3 videos (by engagement) and top 3 video viewers
Category Performance Over Time – graph of video metrics. Choose to view player impressions, plays, unique viewers, minutes viewed, average drop off rate, and average completion rate. Click the View Details toggle option under the graph to see these categories for individual viewers.
Top Videos – see all your videos in a list ordered by most engagement. Shows video plays, unique viewers, average completion rate, and an engagement score for each video.
How player impressions lead to engagement (user dashboard only) – shows the progression of engagement
Top Domains (user dashboard only) – where are people viewing your videos. 2 of these are the Meredith Kaltura system. kaf.kaltura.com is Brightspace. meredith.mediaspace.kaltura.com is Mediaspace.
Now what?
We have video analytics, now what do we do with them? There is a lot of data here but I suggest you look for patterns or odd outliers and ask lots of questions.
Example: 1 video is performing very poorly compared to the rest
- is the video boring?
- is it too long?
- can the students easily find the video to watch it?
- what is the purpose of the video?
From here we can dig into the individual video analytics or ask students to understand why this video is not being used.
Just think of this dashboard as one more tool in assessing the effectiveness of your videos or class. If it seems overwhelming, start by taking the best performing video and looking into what is working for this video. Then you can small steps into more analytics analysis.
For any Kaltura or video help, please reach out to the IDAT team for assistance.